


Rollup Metrics
Scale from 1 site to 10,000 with dynamic KPIs and slicers that make portfolio-wide filtering, navigation, and performance comparison effortless.

Savings and ROI Tracking
Track energy conservation measures (ECMs), validate savings, and quantify ROI and total cost of ownership (TCO) across your entire portfolio.

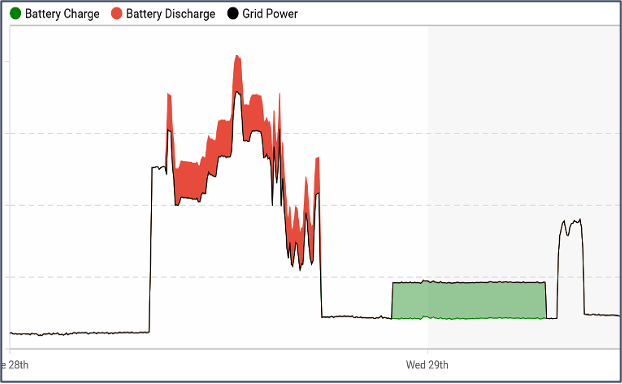
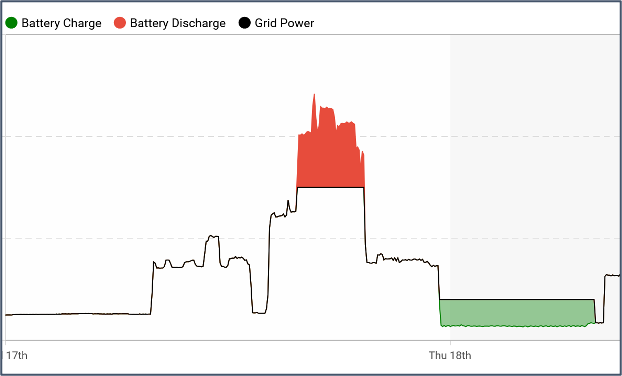
Peak Demand Analysis and Forecasting
Predict and manage ICAP and 4CP/5CP events with real-time demand forecasting to avoid penalties and optimize grid participation.
Load and Usage Analysis
Identify usage patterns, optimize load profiles, and uncover efficiency opportunities with deep, site-specific and portfolio-wide analysis.
Utility Tariff and Market Cost Analysis
Integrate live tariff structures, ISO/RTO pricing signals, and market data to optimize energy spend and strategy in real time.

SkySpark Advanced Analytics
Leverage automated fault detection, customizable machine learning models, and advanced data visualizations powered by SkySpark's analytics engine.

Solar Production and Net-Zero Tracking
Monitor solar generation, track net-zero goals, and automate GHG reporting to meet corporate sustainability and regulatory targets.

Interactive Portfolio Navigation
Slice, dice, and map your portfolio with real-time dashboards, dynamic heatmaps, and customizable navigation tools to spot trends instantly.